Navigating Silver
Historically used as a currency, currently a major component in solar and electronics due to high electrical conductivity
Scientific Properties of Silver
Silver, with the chemical symbol Ag and atomic number 47, is a precious metal known for its distinctive lustre and high electrical and thermal conductivity. It is less reactive than other metals, making it resistant to corrosion and oxidation. Silver exhibits the highest electrical conductivity of all metals, making it indispensable in electronic applications. Additionally, it has significant thermal conductivity and optical reflectivity, making it useful in various industrial and scientific applications. Silver has an atomic weight of 107.8682 u, a melting point of 961.78°c, and a boiling point of 2162°c. It also possesses notable antimicrobial properties, contributing to its use in medical and hygiene products.
Uses and Future Applications
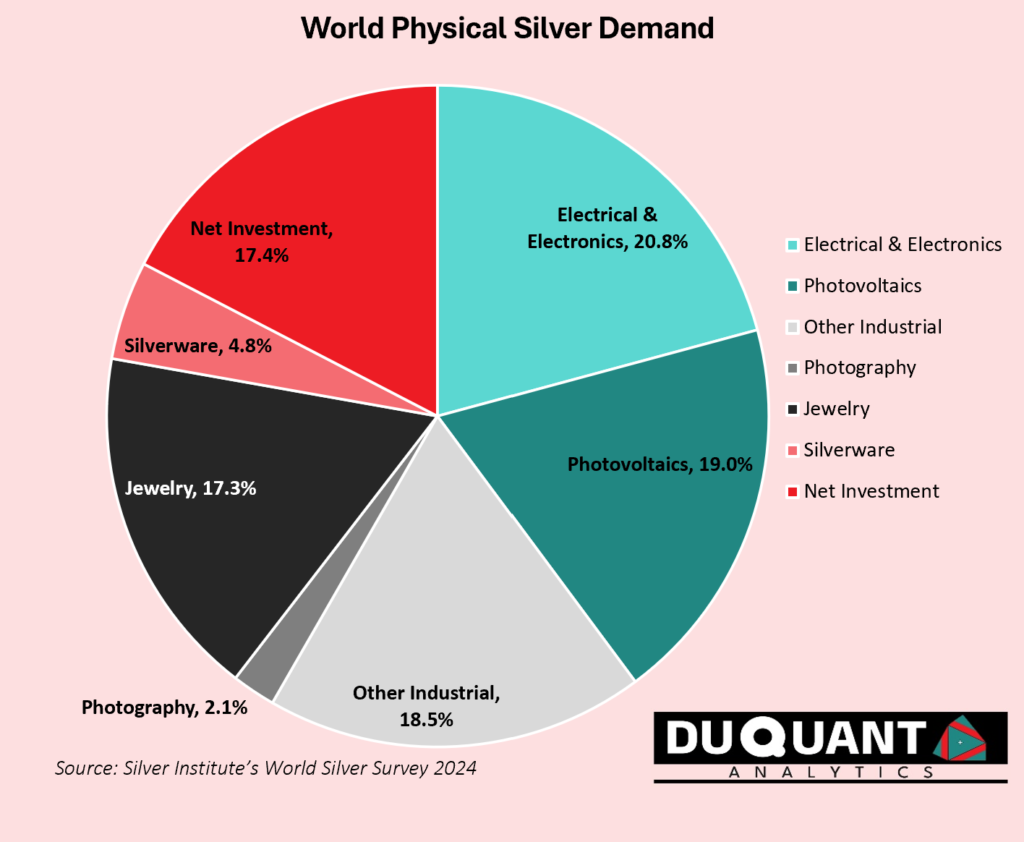
Currently, silver is widely used in various industries, including in electronics and as solder (c.40% of 2024 silver demand), which is the glue holding electronics together, solar/photovoltaics (c.19% of demand), jewellery (c.17% of demand), photography (c.2% of demand), in silverware (c.4.8%) and as an investment (c. 17% of demand). Its high conductivity makes it a key component in electrical contacts, conductors, and solar panels. In medicine, silver’s antimicrobial properties are utilized in wound dressings, coatings for medical devices, and water purification systems. Silver is also used as a catalyst in chemical reactions.
Looking towards the future, silver’s role is poised to expand significantly due to its importance in green technologies and the energy transition. Silver is crucial in the production of photovoltaic cells for solar panels, which are expected to see increased demand as the world shifts towards renewable energy sources. Additionally, silver’s use in electric vehicle components and advanced battery technologies highlights its potential as a critical material for the growing electric vehicle market. Simultaneously, annual mine production of silver has been in steady decline since 2014, which is a dynamic that could provide investors with opportunities to capitalize on silver’s expanding utility in future-facing industries driven by sustainability and technological advancements.
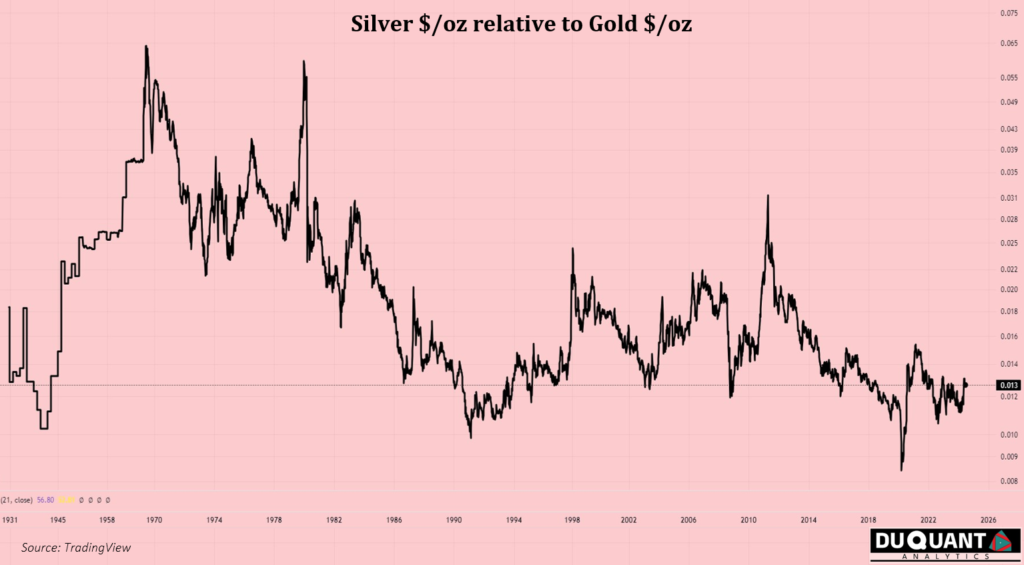
Silver has also historically been a store of value as a precious metal and often bought by investors as a hedge against inflation (or fiat currency depreciation). With the recent rise in gold and commodity prices that have occurred in 2024, its vital to also understand that even though the silver price increased (roughly from $23/oz to $29/0z), it needs to be viewed through a lens of relative performance to understand if there is room for further increases, or to indicate if it has increased too much too quickly. Based on the historical ratio to gold, silver is still relatively trading at attractive levels. As seen in the figure below, silver is trading at 0.013 relative to gold (June 2024), when in the 2000’s the ratio hovered around 0.020 (almost double), and in the 1940s to 1980s it hovered at a ratio of 0.030 to gold (almost triple the current value). Given silver’s strong use case in solar panels and other electronics, the fundamental drivers present a strong demand outlook for the metal and opportunity for long term investors.
Largest Sources and Producers of Silver
Just like gold, silver is a metal found in many places and all over the world. Silver is also rarely found as a native metal as silver ores are very often found in conjunction with gold, lead or copper ores. This is also why the price of lead and copper is somewhat influenced by the price of silver as the mines make profits from all ores that are present, not just silver.
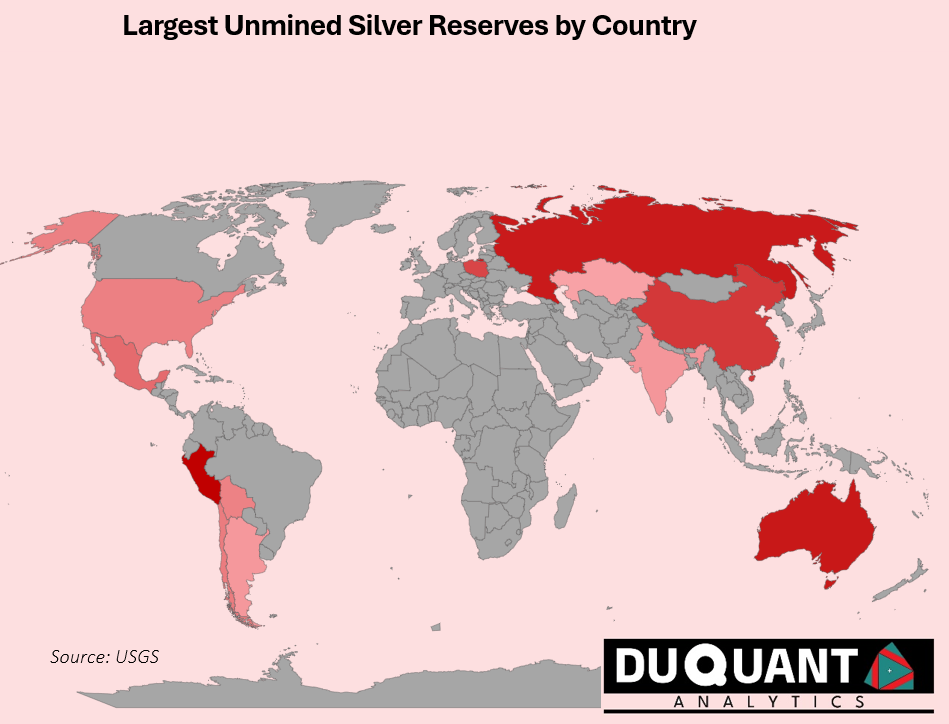
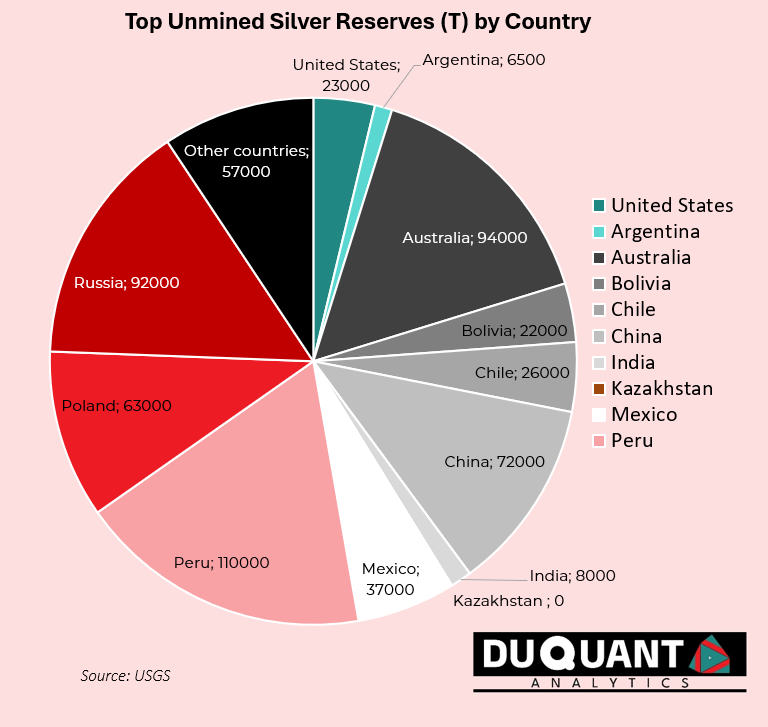
According to the 2024 US Geological Survey (USGS), global silver reserves stand at 610,000 tons with the largest reserves being Peru (110,000t), Australia (94,000t), Russia (92,000t), China (72,000t), Poland (63,000t), Mexico (37,000t), Chile (26,000t), United States (23,000t) and Bolivia (22,000t). The remainder of the world makes up 71,000t.
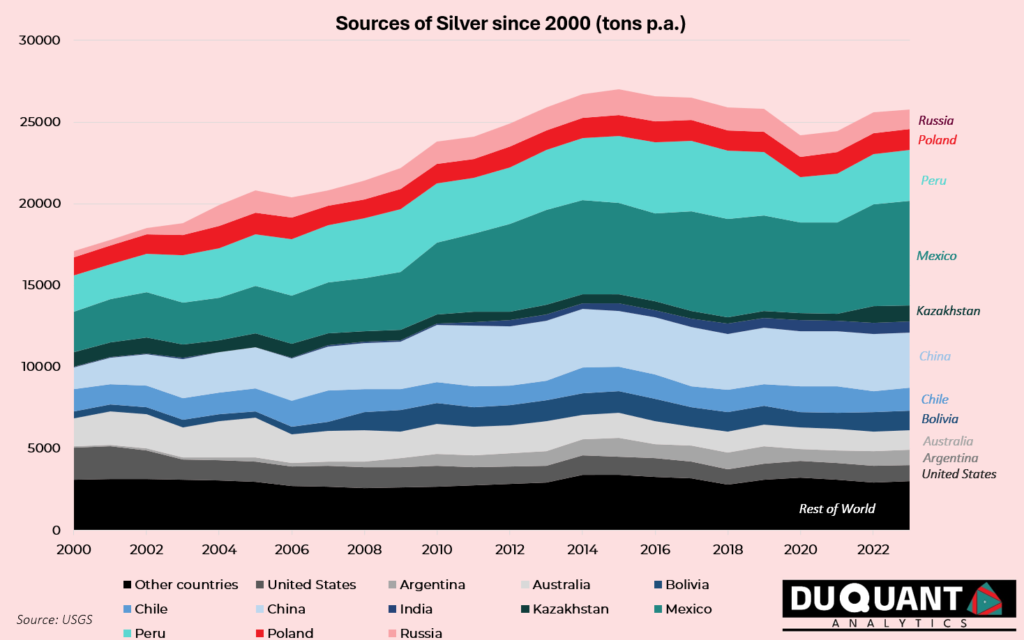
In terms of total annual mine production, since 2000 approximately 19% of mined silver came from Mexico, followed by Peru (15%), China (13%), Australia (7%), Chile (6%), Poland (5%), United States (5%), Russia (5%), Bolivia (4%) and the rest of the world making up 20%. The below figure shows the trends of the largest silver mine production trends since 2000. There has been a noticeable steady decline in output since 2014, meanwhile a strong demand outlook for the metal into the future. Another important thing to note is that mining accounts for c.82% of annual silver supply, while recycling makes up the remaining c.18% of supply.
As the world shifts to EV’s the requirement for electronic components would increase drastically. The same thing will likely occur with the solar panel market as the demand for off grid solutions becomes more popular. These two markets, electronics and solar panels, account for 55% and 16% of silver demand, respectively. From a manufacturing perspective there will be a push to keep the silver price as low as possible, however, given the decline in mine production over the last decade, high inflation and energy transition tailwinds, the outlook for silver from an investment perspective is positive.
The Remarkable History of Silver
Silver is a metal of unmatched brilliance and utility, with a rich history that spans over five millennia, intertwining with the rise and fall of great civilizations. Silver is fairly easy to mine and refine and thus even very early in history humans were able to find and work with silver. With its brilliant white appeal, scarcity and beauty, silver has always been considered a precious metal and store of value.
The story of silver mining began around 3,000 BCE in Anatolia, modern-day Turkey, where early miners extracted the precious metal that would help flourish early civilizations in the Near East and Ancient Greece. By 1,200 BCE, the epicentre of silver production had shifted to the Laurion mines in Greece. These mines not only fed the region’s growing empires but also provided currency for ancient Athens, playing a pivotal role in its ascendance. The silvery veins of Laurion fueled the ambitions of statesmen and generals, supporting Athens in its cultural and military pursuits.
As history marched forward, the Roman Empire became the next great beneficiary of silver’s wealth. By around 100 CE, Spanish mines, rich with silver, became a major supplier to the Romans, who used the metal to finance vast armies and monumental architecture. Silver from Spain also became a crucial trading component along the Asian spice routes, facilitating an early form of global commerce.
However, the most transformative chapter in silver’s history was written with the European discovery of the Americas following Columbus’s 1492 voyage. The Spanish conquest of the New World unveiled vast silver deposits in Bolivia, Peru, and Mexico. The mines of Potosí in Bolivia and Zacatecas in Mexico, among others, churned out unimaginable quantities of silver, with these regions accounting for over 85 percent of global production between 1500 and 1800. This silver flood bolstered Spanish influence globally, underwriting an empire on which the sun never set and facilitating the first global trade networks.
The 20th century brought significant developments, transformations and upheavals to the silver market. One of the first major events was the Pittman Act of 1918, which authorized the melting of up to 350 million existing silver dollars to aid Britain during World War I. Britain faced a currency crisis in its largest possession, India, necessitating vast amounts of silver to back issued certificates. The US supplied this silver by melting 270 million silver dollars, which sat unused in Treasury vaults. To gain support from Western states in Congress, it was stipulated that every melted silver dollar had to be replaced by new ones, leading to the issuance of the Peace Dollar in 1921.
In 1934, President Franklin D. Roosevelt’s Silver Purchase Act authorized the government to nationalize domestic silver mines and confiscate privately-owned silver, excluding circulating coinage. Citizens could only own a maximum of 500 ounces of non-monetary silver. The government was mandated to buy silver at 50 cents per ounce, nearly double the market price, which supported the struggling silver industry.
Post-World War II, the Silver Purchase Act of 1946 made the US the top silver buyer globally, purchasing domestic silver at 90.5 cents per ounce, slightly above the market rate. This subsidy led to a boom in domestic silver mining, tripling production as companies had a guaranteed price to sell at. However, by 1959, a global silver shortage emerged due to the economic boom and increased demand. The US Treasury began selling silver to keep prices under $1.29 per ounce to prevent the profitable melting of silver dollars.
The 1960s saw silver prices rise permanently above 91 cents an ounce in 1961, leading President John F. Kennedy to halt government silver sales and retire $5 and $10 silver certificates. As prices continued to climb, the Coinage Act of 1965 removed all silver from dimes and quarters and reduced the silver content in half dollars to 40%, marking the end of silver in circulating coinage. By 1968, silver certificates were no longer redeemable for silver, signalling the end of an era.
The 1970s and 1980s were marked by dramatic events, including the Hunt brothers’ attempt to corner the global silver market. In 1980, after gaining control of three-quarters of the world’s silver, the Hunts’ scheme was derailed by regulatory changes, causing silver prices to plummet from $50.35 per ounce to $15.80 within months. Despite this, silver production finally caught up with demand, stabilizing the market.
In 1985, the introduction of the American Silver Eagle bullion coin catered to persistent investor demand, becoming the world’s leading silver bullion coin. The launch of the first silver Exchange-Traded Fund (ETF) by iShares in 2006 further revolutionized the market, providing investors with an easy and liquid means to invest in silver.
The 2008 Global Financial Crisis saw a surge in demand for silver as a safe haven, with prices hitting $20.92 per ounce. Silver ETFs experienced record inflows, and the physical silver market faced shortages, forcing the US Mint to ration Silver Eagle coins. In 2011, debt crises in the US and EU drove silver prices to an annual high, with physical silver investment demand reaching new records.
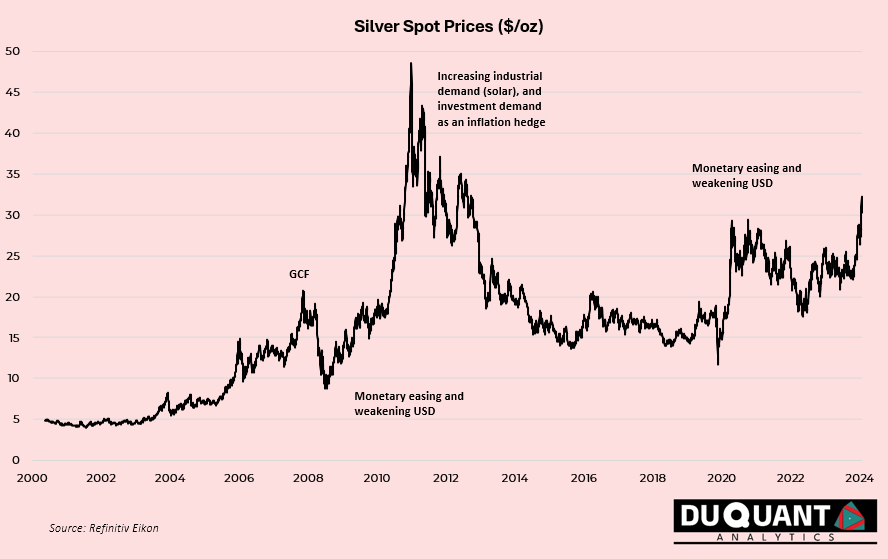
By 2015, American Silver Eagle sales hit a record 47 million ounces, reflecting robust investor demand. Total physical silver investment demand also set a record at 292.3 million ounces, pushing silver supplies into a deficit for the third consecutive year. This period highlighted silver’s enduring appeal and its critical role in both historical and modern economies. Today, more than 5,000 years after ancient cultures first began mining silver in small amounts, global silver mine production has soared to nearly 800 million ounces annually as of 2019. This incredible journey from the small ancient mines of Anatolia to the vast operations across the globe highlights silver’s enduring value and its profound impact on human history. The most important deposits, such as those in Bolivia, Peru, Mexico, and the Comstock Lode, not only changed the face of silver mining but also left an indelible mark on the world, shaping economies and societies for centuries.
Download This Post in PDF
RESEARCH DISCLOSURE
Purpose: DUQUANT Analytics provides research notes and newsletters for market insights, analysis, informational, educational, and research purposes only. We adhere to the CFA Institute’s Code of Ethics and Standards of Professional Conduct which includes maintaining the highest standards of integrity, transparency and professionalism in all research activities. We strive to ensure that our investment analysis and actions remain unbiased and focused on delivering accurate information based on available knowledge at the time of release. We follow industry accepted methodologies for conducting due diligence and conduct our analysis on a reasonable basis.
Investor Responsibility and Limitation of Liability: This content does not constitute a recommendation to buy or sell any securities. It is essential to understand the nature of our research, which is for educational and informative purposes. It is imperative to conduct your own due diligence and research prior to making any investment. DUQUANT Analytics is not liable for any losses incurred from using our research. Information released is believed to be reliable, but not guaranteed for accuracy or completeness. It is also important to note that past performance is not reflective of future performance.
Potential Conflict of Interest: Personal Investments: Members of DUQUANT Analytics may hold positions in some of the assets or securities mentioned in our research notes and newsletters. This includes equities, bonds, commodities and other financial instruments. Despite any personal investments, our research is conducted with the highest level of integrity, independence and objectivity. We strive to ensure that our analysis remains unbiased by focusing on accurate, public and provable information and secondary data as it is released or becomes public.
Conclusion: DUQUANT Analytics is committed to providing high-quality research and insights to our readers. However, it is essential for investors to take responsibility for their own investment decisions and to understand the inherent risks involve, especially in mining which carries more risk than traditional assets. We encourage you to consult with a qualified financial advisor and to perform thorough research before making any investments.
Thank you for reading this disclosure note. We value your trust and strive to maintain the highest standards of integrity in all our research activities.

